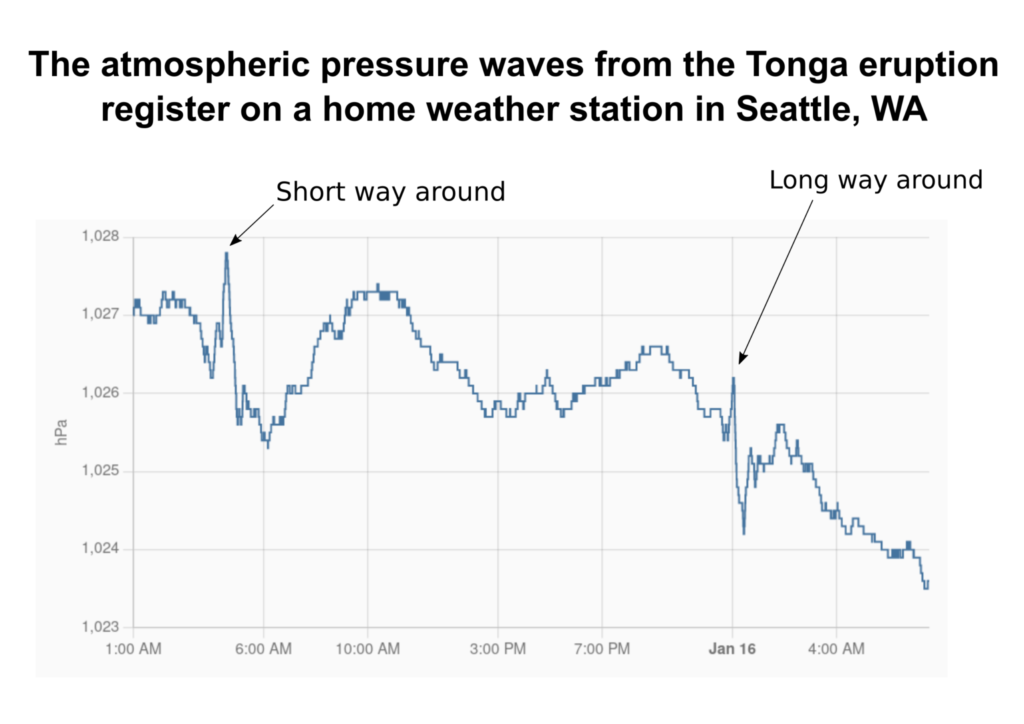
The Tonga eruption on January 14, 2022 sent a big shock wave out in all direction in the atmosphere. I had once read about how the Krakatoa eruption shock wave was measured 7 times going around the world, so I wondered if I could measure it with my weather station. Sure enough, I could!
I have two pressure sensors that update every 30 seconds. One is inside and the other is outside. 8.5 hours after the eruption, the first wave reached my house (traveling directly from Tonga to Seattle). About 15 hours later, another wave reached my house, this one traveling the opposite direction from Tonga to Seattle around the back way. Both of these waves registered well on my sensor.

Given the time of arrival, I figured I could probably predict when to look for the 2nd and maybe even 3rd passes of these waves if they made it all the way around the world multiple times as I had heard about. So I wrote a little python script to predict the times of arrival:
from geopy import distance
import math
import datetime as dt
from zoneinfo import ZoneInfo

tonga = (-20.550000, -175.385)
seattle = (47.63, -122.33)


pt = ZoneInfo("America/Los_Angeles")
# https://earthquake.usgs.gov/earthquakes/eventpage/pt22015050/executive
eruption = dt.datetime(
    2022, 1, 15, hour=4, minute=14, second=0, microsecond=0, tzinfo=dt.timezone.utc
)

wave1 = dt.datetime(2022, 1, 15, hour=4, minute=21, second=34, microsecond=0, tzinfo=pt)
wave2 = dt.datetime(2022, 1, 15, hour=23, minute=50, second=5, microsecond=0, tzinfo=pt)

dist = distance.great_circle(tonga, seattle)

d1 = dist.km
circum = 2 * math.pi * distance.EARTH_RADIUS
d2 = circum - d1

td1 = (wave1 - eruption).total_seconds()
td2 = (wave2 - eruption).total_seconds()

s1 = d1 / td1
s2 = d2 / td2
speed = (s1 + s2) / 2.0

print("{:4s} {:>30s} {:>30s}".format("Pass","Short way", "Long way"))
for loop in range(7):
    t1 = wave1 + dt.timedelta(seconds=circum * loop / speed)
    t2 = wave2 + dt.timedelta(seconds=circum * loop / speed)
    print(f"{str(loop+1):4s} {t1:%30c} {t2:%30c}")
This code prints out the following predictions:
| Pass | Short way | Long way |
|---|---|---|
| 1 | Sat Jan 15 04:21:34 2022 | Sat Jan 15 23:50:05 2022 |
| 2 | Sun Jan 16 15:53:54 2022 | Mon Jan 17 11:22:25 2022 |
| 3 | Tue Jan 18 03:26:15 2022 | Tue Jan 18 22:54:46 2022 |
| 4 | Wed Jan 19 14:58:36 2022 | Thu Jan 20 10:27:07 2022 |
| 5 | Fri Jan 21 02:30:56 2022 | Fri Jan 21 21:59:27 2022 |
| 6 | Sat Jan 22 14:03:17 2022 | Sun Jan 23 09:31:48 2022 |
| 7 | Mon Jan 24 01:35:38 2022 | Mon Jan 24 21:04:09 2022 |
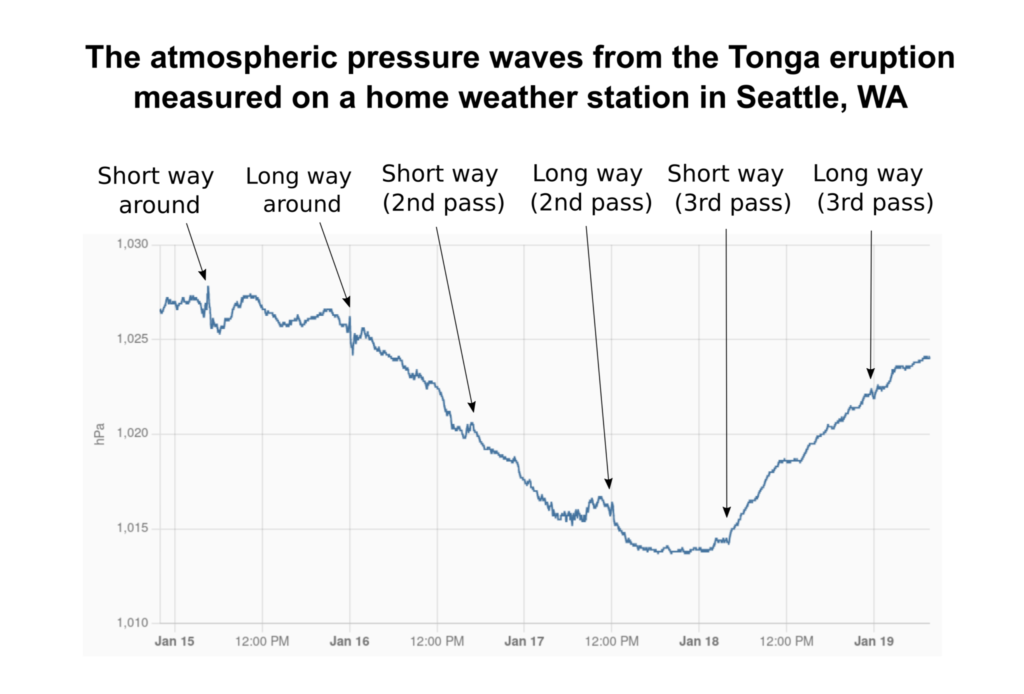
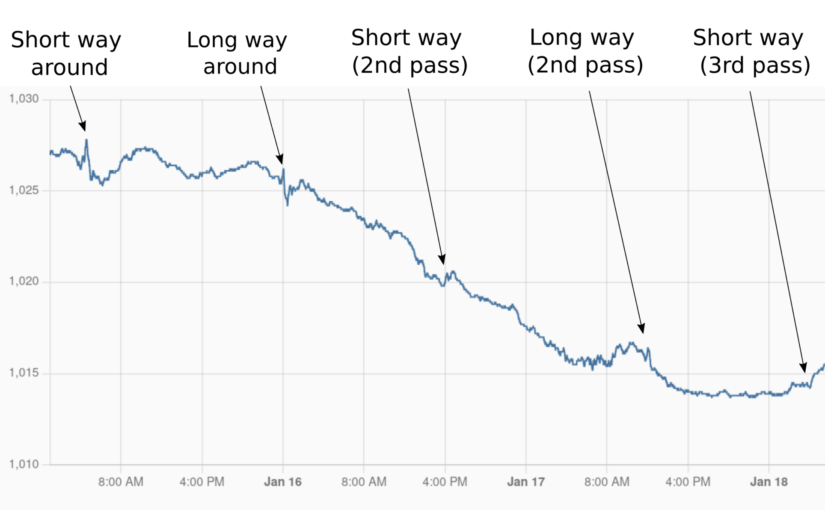
Then I waited. Sure enough, I saw more features for the 2nd passes! The third pass of both waves was arguably detected. The wave was going quiet a bit slower than I predicted, so it must have slowed down over time. The arrivals were between 30 and 60 minutes behind when I had predicted them.

The first 6 sightings of the pressure wave in Seattle
Super fun. I even did my first-ever live stream to see if my first prediction was correct, and of course I tweeted about them a lot.
Super fun. I’ll update the plots if I do see the 4th pass.
