In this post, we’ll take a brief measurement of regular old FM radio stations and try to determine where we are. It’s like a GPS but with local FM transmitters instead of satellites. I did this just for fun. I wonder if it could be used for indoor location and stuff? It is nowhere near as accurate as GPS. But whatever.
 Reading FM radio signal power
The first step is to get a reading of all the nearby radio stations. I used gnuradio and a HackRF One software defined radio. A simple flow-chart that takes the FFT and dumps it to a file is all I needed. I had to throttle the I/O or else my computer would freeze. I used 16M sample rate to have as wide a bandwidth as possible.
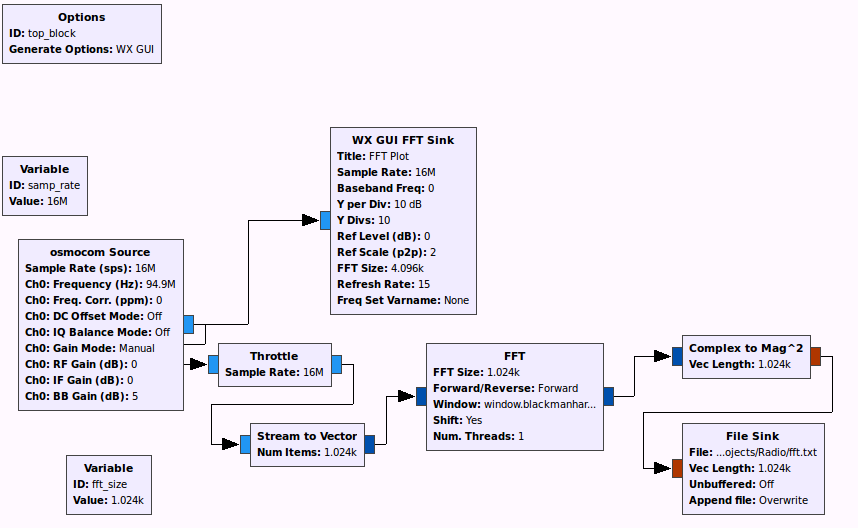
The file sink saves the FFT results in 4-byte integers and just has one 1024-length vector after the other. In a few seconds, I had a 50 MB of data. I did all the post-processing in an external Python script.
Peak-finding in the FFT
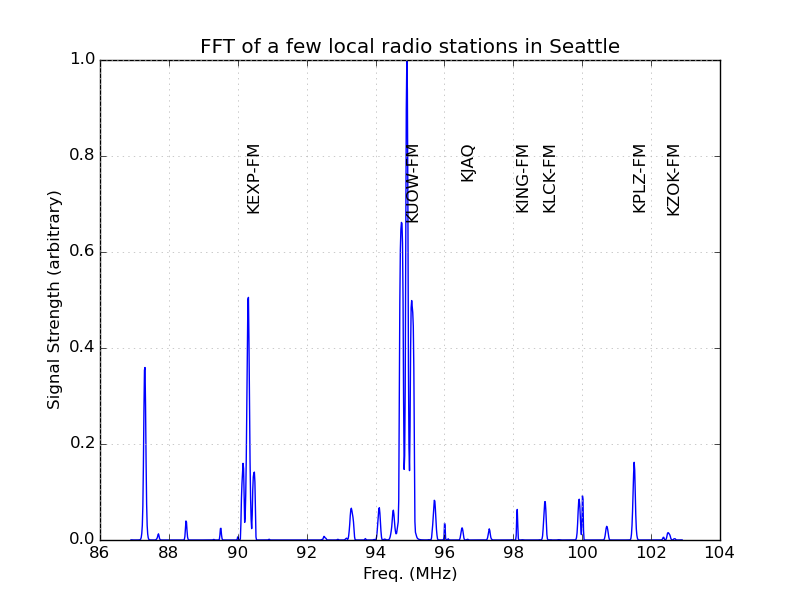
Next I needed to automatically measure the heights and locations of all the stations recorded on the Fourier transform. Sounds like a task for wavelets! This feature is basically built in to scipy, so it ended up being very easy. I used scipy.signal.find_peaks_cwt with peak widths between 10 and 20 (In the US, commercial FM signals are spaced by 200 kHz, so with a sample rate of 16M and an FFT size of 1024, 0.2/16*1024 = 12). This worked pretty well, though I did a little guess-and-check comparing while adjusting wavelet widths. I then rounded to the nearest tenth of a MHz. Woo-eee! That 100kW KUOW tower really booms in from on top of Capitol Hill!
Learning about nearby FM stations
I needed frequency, power level, callsign, and latitude/longitude coordinates for all the nearby FM stations. I found a nice FM search feature at the FCC webpage. Searching by city and filtering to intermediate results, you get something like this:

Excellent! I can parse that in my Python script as well.
Computing the receiver location
Figuring out receiver location from various reference signals is called multilateration, and has been used extensively for years in things like LORAN and GPS. These systems typically have precisely calibrated clocks and use the time-differential at arrival (TDOA) to compute their location. In this project, we are only looking for a rough approximation so we’ll forget about those decades of precise engineering and just assume measured signal strength is somehow correlated to distance. This assumption could break down for a bunch of reasons like terrain and asymmetric building materials. But whatever, let’s see if we can get anything meaningful.
Assume for a second that I can map measured signal strength to distance. Then I can just build a minimization problem solve it using existing tools. The problem to solve is exactly as described in this post, though I can get away with a 2D formulation as long as I stay on the ground.
The scipy.optimize package in Python makes it nearly trivial to use these tools using standard non-linear programming, as you can see in my code.
Signal strength to distance calibration
To solve the problem above, I need to map measured signal strength at one frequency to the distance between me and the tower. Attenuation of radio waves in air follows a frequency-dependent path loss formula. So, to calibrate, I just computed the actual distance between my known location and each tower and evaluated the formula for the expected signal power given the full power of each tower. I plotted this result vs. my measured signal power and did a least-squares fit. The fit was pretty good!
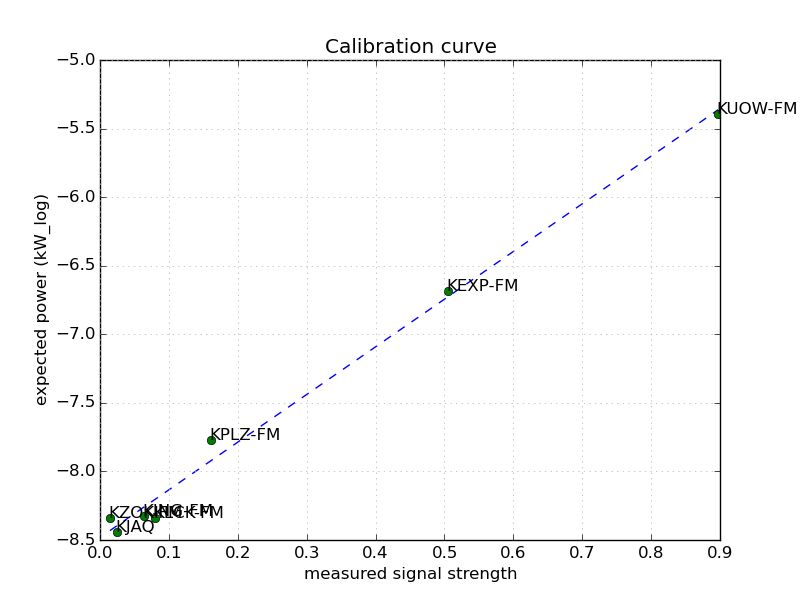 I removed KPWK 93.3 from consideration because I was receiving signals from multiple transmitters it has around and it was messing everything up. Without it, things are lookin’ great! So with this line and the path attenuation formula, I’m good to go on the final minimization routine.
Results
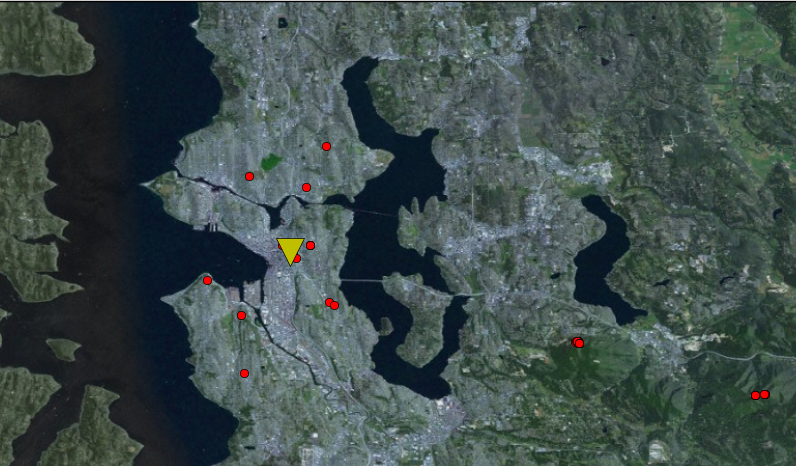
From my base location, it got me within 500 meters, which I was pretty happy about. But I calibrated off of a known location. So what if I drive around town a bit?
Test 1: Work in Bellevue
I work in Bellevue, about a mile north of the I-90 and I-405 intersection. Let’s see how the system does:
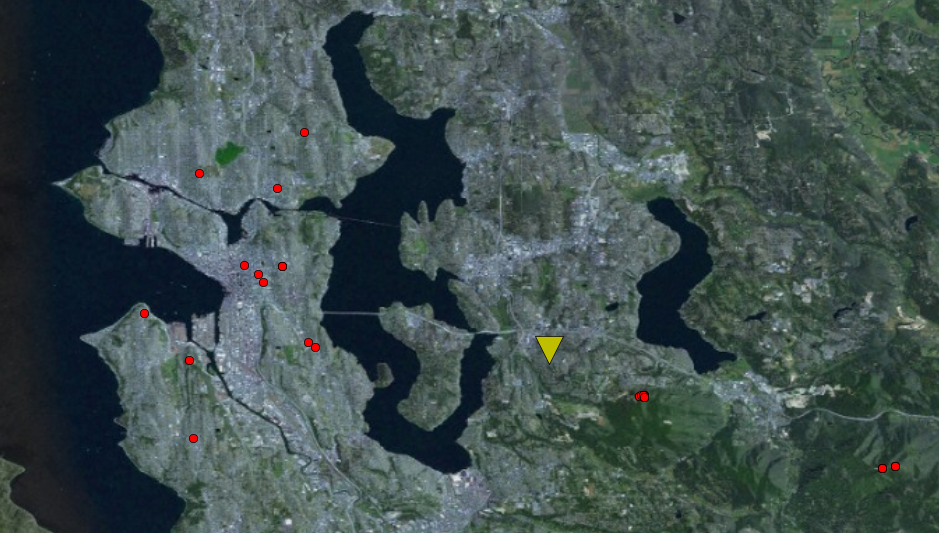 Woo! Not excellent, but not bad either for being so far from the main cluster of towers. Looks like it’s working.
More tests coming soon.
Next steps
I was wondering if instead of solving the multilateration equations if you could just use machine learning and pattern matching and get similar or even better results. I could imagine a fleet of mobile radios (like, in people’s cars for example) driving around taking readings and using GPS to train the system. Then once it’s all trained up, it might be very accurate, and it would work well in tunnels and in the event of a GPS outage. Not sure if this is worth looking into but it could be fun.
The other thing you could do is tap in more formally to the databases of FM stations worldwide and figure out where you are in places other than just Seattle.
Epilogue
I had a lot of fun with this project because it really touches on a wide variety of pretty cool things, from radio wave attenuation to wavelet transforms to GIS mapping to nonlinear optimization. Good stuff. What a world!
“scipy.optimize package in Python makes it nearly trivial to use these tools using standard non-linear programming, as you can see in my code.”
I am new to this stuff, do you have code available for the peak detection? I can’t find any on github and writing this over again seems like a real pain.
Sorry, I guess I never posted the code. Here’s the relevant section. Define a function and then minimize it:
stationPowers = matchStationsToSignals(stations, radioData)
def f(latlong, stationPowers):
#lat, long, calibB, calibM = latlong
#latlong = (lat,long)
distances = []
signalDistances = []
for station, signalPower in stationPowers:
# each station has 1 or more transmitters. Collect them all.
distances.extend(station.distanceTo(latlong))
signalDistances.extend(station.estimateDistanceFromMeasured(latlong, signalPower))
# normalize
distances = numpy.array(distances)/max(distances)
signalDistances = numpy.array(signalDistances)/max(signalDistances)
val = 0.0
for distance, signalDistance in zip(distances, signalDistances):
contribution = (distance - signalDistance)**2
val += contribution
return val
result = scipy.optimize.minimize(f, numpy.array((47.0, -120.0)), args=(stationPowers,),
bounds=((46, 48), (-123, -121)))
print(result.x)
myLoc = result.x[:2]
plotStations(stationPowers, myLoc)
return myLoc
Would you mind posting all of the code for this somewhere? It would be a lot of fun to try out, but it’s way beyond my skill level to write code to do this based on the blog post.
Really cool project, and interesting results!
Sorry for not being more specific, I am trying to figure out how to turn the fft file sink into a usable format in order to find peaks and their amplitudes using scipy.
Direction finding is the second half of the project, but I need to get the first bit up and running first.
Gotcha. Here’s a method that reads the binary output file created by the file sink. Sorry that the formatting is off. Will get it on github someday.
def getAvgFFT(self, fname):
"""
Reads FFT data from GNURadio file and averages it.
GNU radio dumped 1024-byte sequences of FFT data to the file. Each 4-bit byte
represents an integer. We unpack and average them here before returning.
"""
print('Reading and averaging FFT data')
ints = numpy.zeros(SIZE)
num = 0
with open(fname, 'rb') as f:
while True:
chunk = f.read(SIZE*4)
if not chunk:
break
byteString = [chunk[4*i:4*i+4] for i in range(SIZE)]
intString = [struct.unpack('i', byte)[0] for byte in byteString]
ints += numpy.array(intString)
num += 1
# divide by FFT size (see GRC wxFFT src code)
avgFFT = ints/num/SIZE
# convert to arbitrary dB. nm, it's already there
#avgFFTdB = 10 * numpy.log10(avgFFT/min(avgFFT))
# rescale to get rid of noise.
avgFFT -= min(avgFFT)
avgFFT/=max(avgFFT) # normalize to 1
self.spectrum = avgFFT
Hello Nick,
I’m trying to reproduce your experiment. I’m able to save samples from GNU Radio and to read them (by the way, I use fromfile to read the data).
However, I couldn’t manage to plot the FFT as you did (“Peak-finding in the FFT”). How did you centered your graph on the desired frequencies?
Many thanks,
cigale.