I happened upon a polar sun path chart a while back and really thought it was a great graphic. It shows where the sun goes each day as a function of the seasons. Behold:
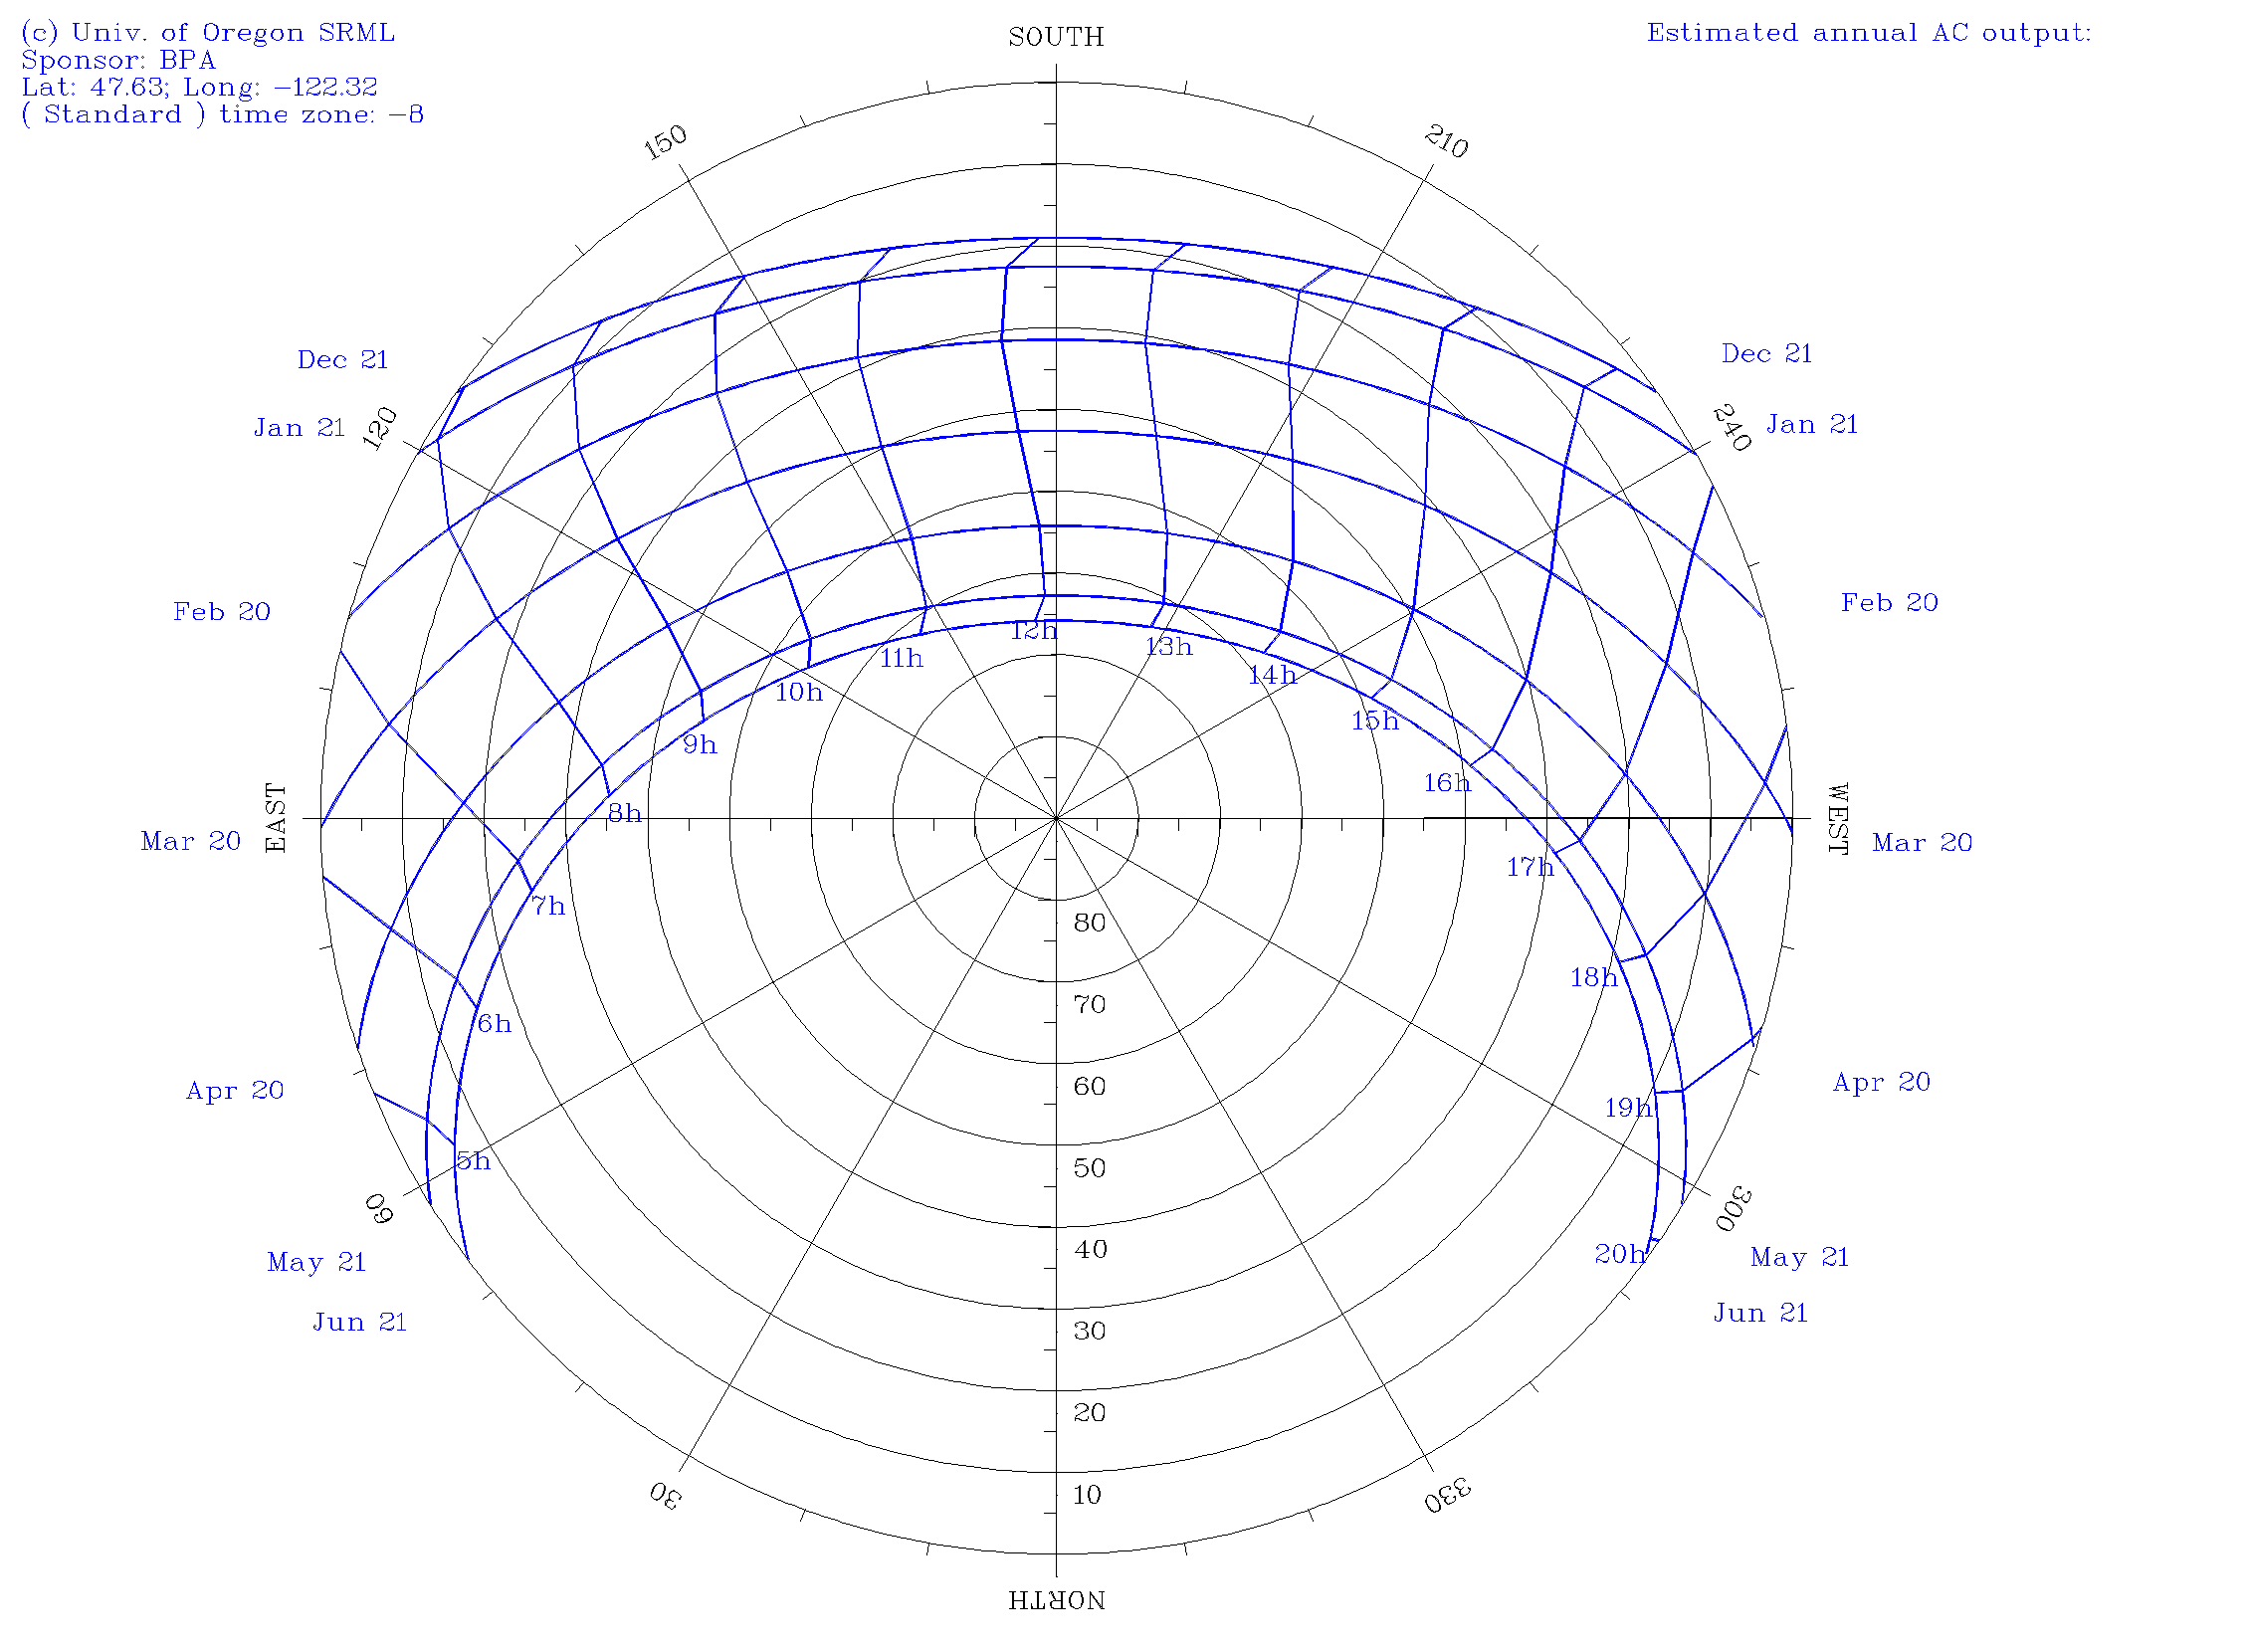
For Seattle, you can see at the top that the sun rises in the SE, peaks at 20° above the horizon, and then sets at 4:30pm on the winter solstice. Ugh. But in the summer, it’s up from before 4am to after 8pm, and peaks above 60° . You can make one of these plots for your area over at the University of Oregon’s Solar Radiation Monitoring Lab.
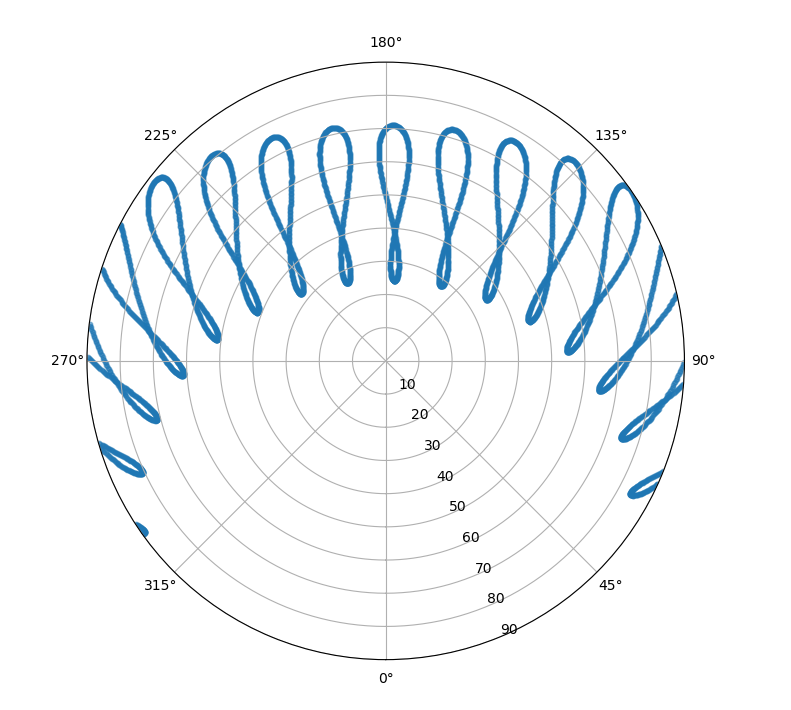
I liked this plot so much that I wanted to take it to the next level and see where the sun is live. In my experience with Python, I’ve grown to expect there to be sweet libraries that can compute stuff like that. Sure enough, there are a few. First, I found pysolar, which is really straightforward, fast, and simple. A few lines of code and I was up and running.
The code for this is nearly trivial:
import datetime
import math

import matplotlib.pyplot as plt
from pysolar import solar

LOC = (47.607,-122.33)
HOURS=1
DAYS= 365

def plotAll():
    start = datetime.datetime(2019,1,1,0,0,0,0)
    delta = datetime.timedelta(hours=HOURS)
    data=[]
    for interval in range(DAYS*24//HOURS):
        now = start + delta*interval
        alt = 90 - solar.get_altitude(*LOC, now)
        azi = solar.get_azimuth(*LOC, now)/180.0*math.pi
        if alt<=90:
            print(now, alt, azi)
            data.append((alt,azi))
    fig = plt.figure()
    ax = fig.add_subplot(111, projection='polar')
    alts, azis = zip(*data)
    c = ax.scatter(azis, alts, s=10, alpha=0.5)
    ax.set_theta_zero_location('S', offset=0)
    ax.set_rmax(90)
    plt.show()

plotAll()
But then as I fiddled with it, I realized I really wanted something that was going to show the Moon as well. And while I was at it, maybe a few more planets. I found the skyfield library, which looked perfect.
Since I want it to be live, I figure the best place to put it is in my self-hosted home automation setup based on Home Assistant (which I’ve written about a lot), right in the weather section. This is basically just local weather information.
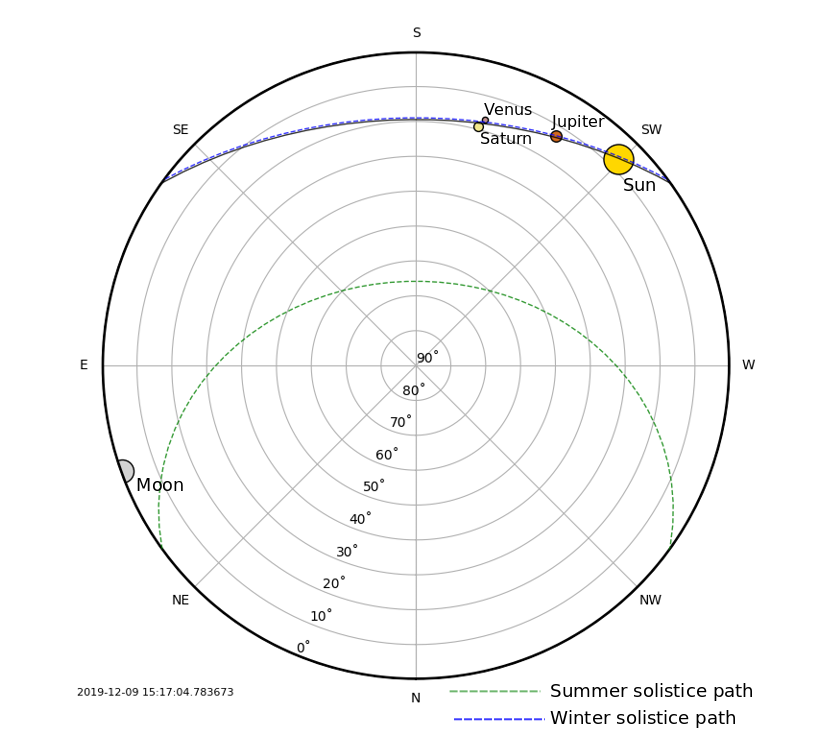
So I coded it up as a custom component and added it to my setup. I published it on github and told the Home Assistant community about it. Here’s what it looks like:
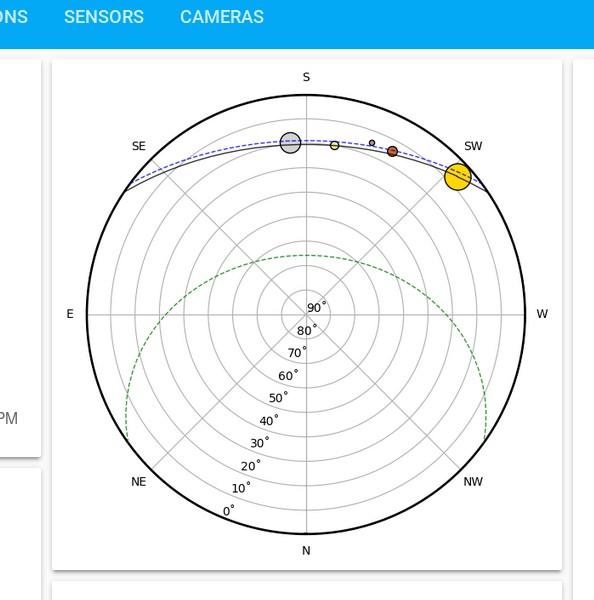
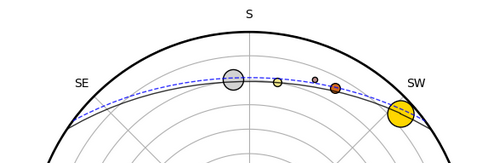
As I watched it one day, during the sunset, it looked like some planets were supposed to be out. In the figure above, Jupiter, Saturn, and Venus are closely following the sun into the sunset. The moon was right there to the south but I didn’t see the planets readily. I eventually noticed Venus in the sunset, and then scanned around with my binoculars and, sure enough, I found Jupiter and Saturn too! How about that!
(I realize I could pull up Google Sky Map or similar and do the same thing, but it’s somehow more fun to have a live local version alongside my weather sensors)
A few days later, I’ve gotten used to where the sun rises and sets at this time of year. Out on a jog, I noticed where the sun was. Since I have been paying attention to this plot, it was easy for me to intuit where on the path it is at that time. From this, I was able to immediately orient myself in terms of the cardinal directions. It felt like a revelation.
(I also realize anyone can do this just by thinking about it, but having the polar plot really helped drill it in somehow)
So, this thing is a pretty solid clock, calendar, planet map, and compass! Tons of fun.
For future development, it’d be nice to have an actual web/javascript frontend. Eventually, I’d really like to have this mounted on a wall.
Later on, I added a legend and some constellations:

And just for fun, here’s a great video:
hi Nick,
I found my way here from whatisnuclear. Thanks for all you’ve written!
I’m curious why you put South at the top of your plot? In Seattle (soon to be my home too) and for most folks in the northern hemisphere I’d think that North on top would be more intuitive… low in the sky would be low on the chart, e.g. at noon, the celestial bodies would arc “up”, etc. You could even prune the northern portion of the chart where the ecliptic never reaches.
Hi Hugh. I started with North on top, since that seemed right to me too. But then I asked myself why the University of Oregon’s Solar Radiation Monitoring Lab put South at the top. As I played around and tried it out, I found that if I put the image on my phone and pointed it South, it lined up perfectly with physical reality and the Sun moved left to right (East to West) along the arc. Now I’m convinced that this is the best way to do this image. If North was on top, I’d be facing north when looking at it and craning my neck to see the Sun behind me. Anyway at least that’s what I’ve convinced myself. Good luck on your move!
This is neat thanks