Since I’m on a late 1800s physics kick, I’ve been staring at my Crookes radiometer a lot.
You might remember these from the hands-on museum. Today, these are just novelty items, but back in the 1800’s, there were actually scientific instruments that could quantitatively read out the amount of incoming radiation (like visible or infrared light). They were generally read out using a calibrated spinning disk with slots in it. It’s like when you have a fan spinning in a dark room, and you adjust a strobe light until it looks like the fan isn’t spinning. Then, if you know how fast the strobe is blinking, you know how fast the object is spinning. This is called a stroboscope.
Well, I don’t have a stroboscope. But I do have a digital camera and a computer. As it turns out, I can read the Crookes radiometer using that!
First I got out the tripod and took some video of the spinning radiometer using my Olympus TG-3 point-and-shoot camera. (Conveniently, this camera has video capabilities up to 240 frames per second which will be useful when the radiometer is really spinning fast.)
My plan of attack was to pick a pixel on the video and get a trace of the light intensity (i.e. how white it is) vs. time. This would give me a signal that I could analyze to figure out the frequency of intensity changes, and therefore the rate at which the vanes are spinning. I found a neat little program called ruler in the Ubuntu package manager and used it to pick the point I wanted to start with. I chose one in the where the white vane could be seen.
I had never done much with OpenCV (a computer vision software library), but I knew of it and suspected that it’d be easy to get intensity vs. time. I was right, it’s pretty much the first tutorial. Here’s the result:
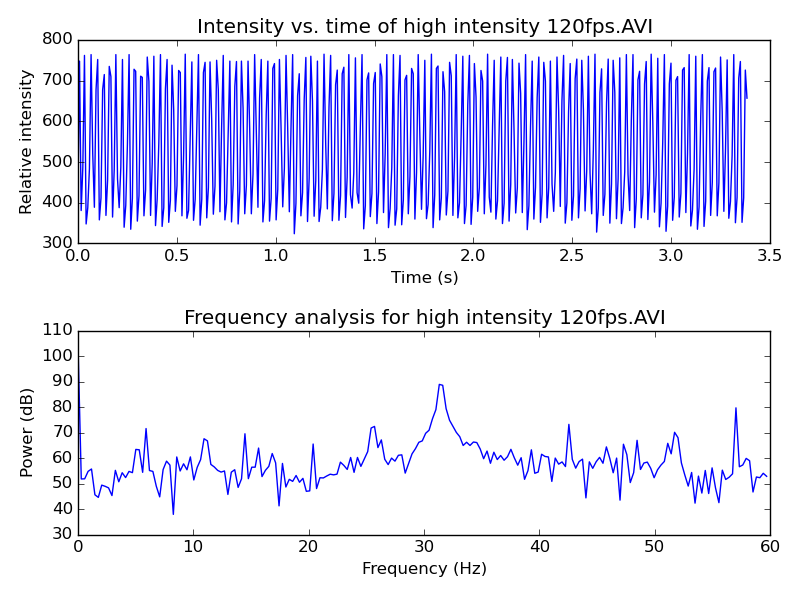
From the frequency analysis plot at the bottom, you can quickly see that the vanes are passing by at about 31.5 vanes per second, or 7.9 full rotations per second (since there are 4 vanes). You can verify this by counting the peaks in the time-domain plot. Excellent! I can’t believe how easy that was.
I ran the same analysis but from the 240 fps video. It gives this:
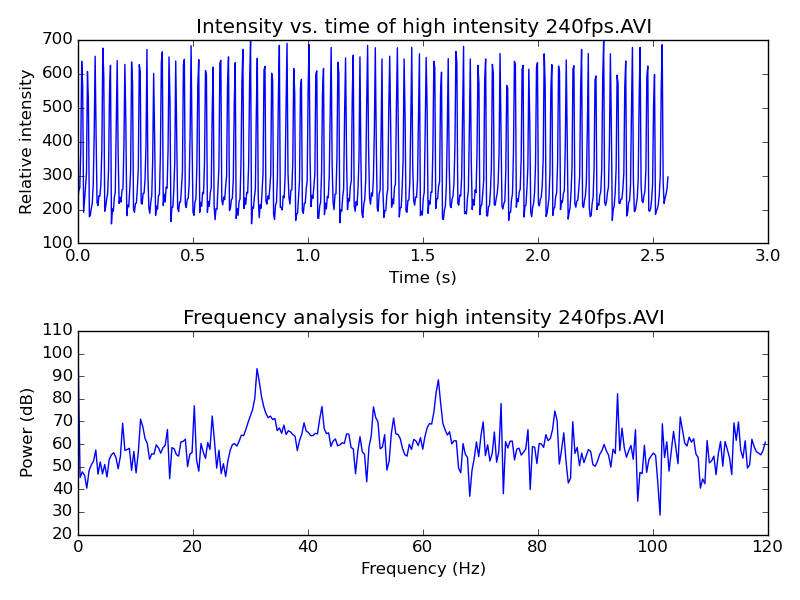
The first peak shows up right at 31.2 Hz, so that’s in good agreement with the slower video. You can also see the higher harmonic at 2x the rate. If you look closely at the video, you can see the 60 Hz pulsation of the lights from the AC mains, but this doesn’t show up well in the FFT.
Here’s the 240fps video:
Here’s the code needed to read the video:
https://gist.github.com/partofthething/bb27d99d85b5d0c6d58d
The full program to do the file reading, intensity analysis, frequency analysis, and plotting is available here.
Unfortunately, at the regular 30 fps, a fast-spinning Crookes radiometer can not be resolved using this method. It’s just going too fast. I think more and more cameras have a slo-mo mode these days so a lot of them should be OK.
Where to go next? If I can come up with a way to keep the camera feeding a Raspberry Pi this kind of data all day, I’d like to plot sunlight vs. time in my apartment. Sure there are easier and more accurate ways to do this nowadays (photoresistors, reading intensity off of the camera directly, etc.), but where’s the Rube Goldberg-meets-physics-history in that?
One extra-cool side thing about this I’d like to point out is that all the software I used for this is completely free and open source, including my home Linux operating system, the OpenCV library, the Python programming language, the Inkscape image editor, the publishing software running this blog and all the server software pushing it through the internet to your computer. What a world.