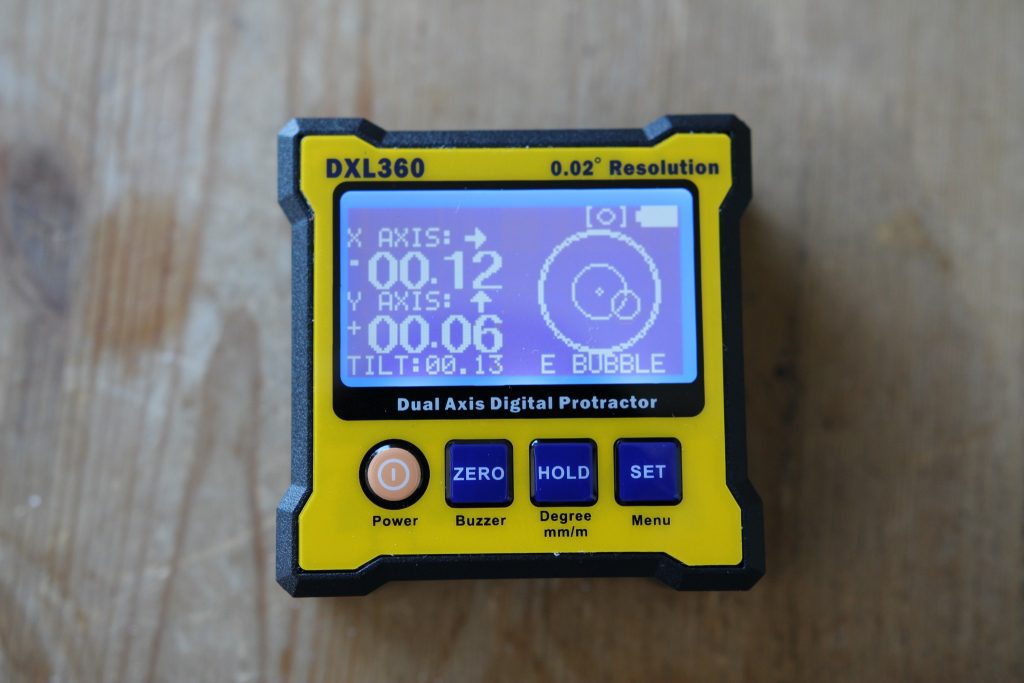
There are some digital levels on the market that are really nice tools to have for a variety of purposes. I grabbed a DXL360 and am really happy with it so far. When I wanted to do an angle vs. time calibration measurement of my Barn Door Startracker over 10s of minutes, I really wanted to get the data from the level into a computer so I could plot and process it a bit.
The level has a USB port but the manual suggests that an optional attachment is required to get it into a computer, at least for this model. However, the manual also states that data comes out of it in RS232 format. I bet I could read that data with some more generic equipment that I have sitting around. And it turned out to be easy. This post shows how I did it.
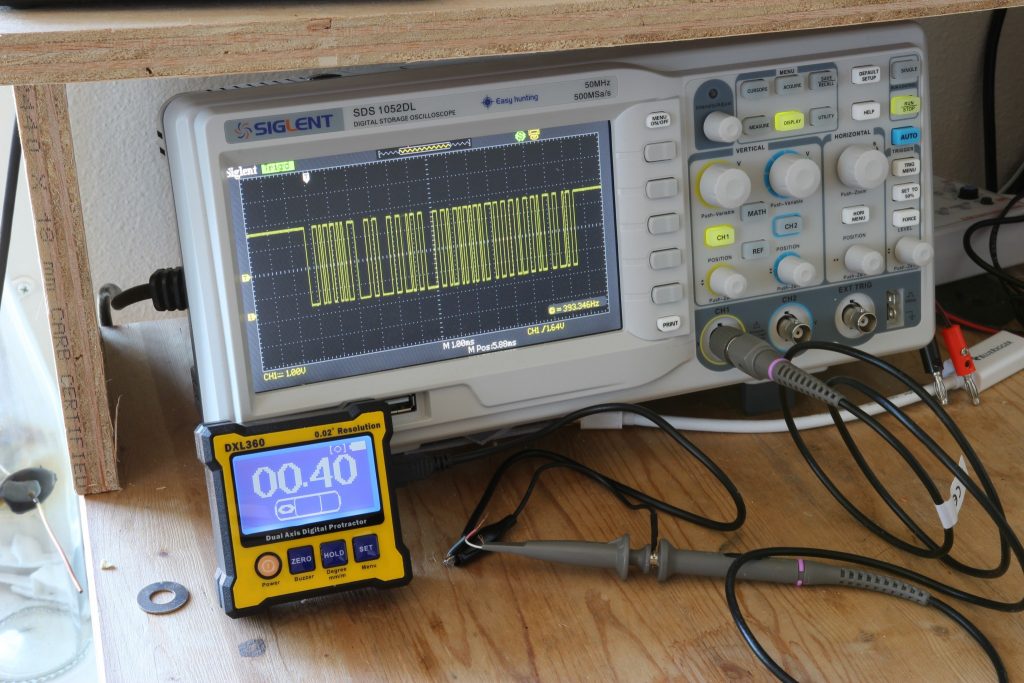
First, I cut a USB cable in half to tap into the level. As a check, I hooked the data lines up to my oscilloscope. I was greeted with a binary bitstream that changed pleasantly as I rotated the level. Looks promising.
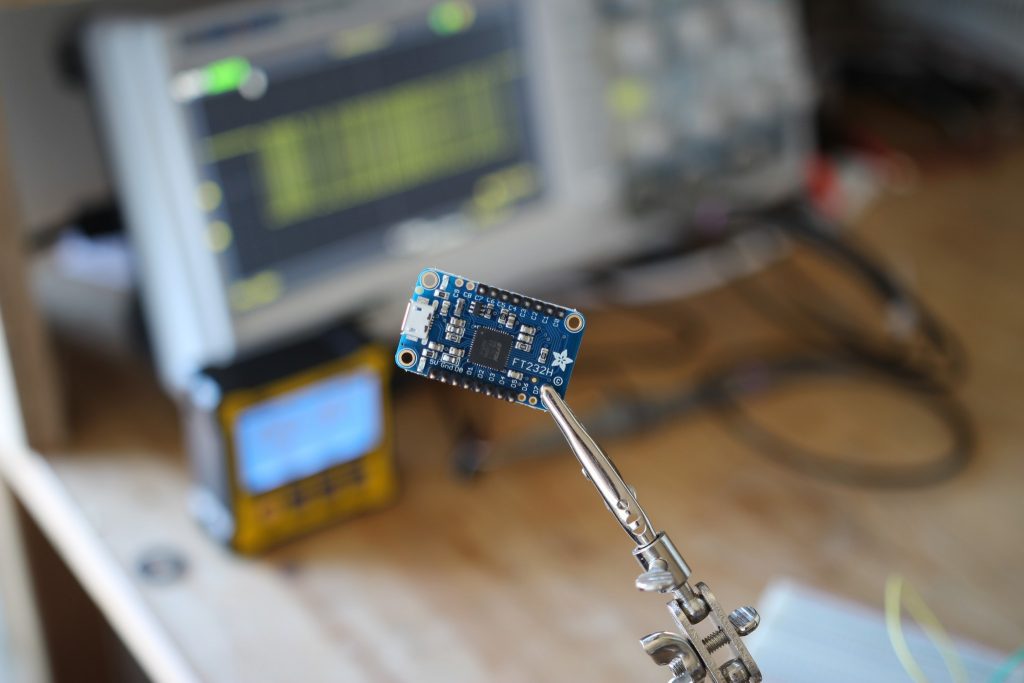
Next, I just plugged the data cables into my extraordinarily useful Adafruit FT232H breakout board, which is basically a universal attachment for these kinds of things. I love this chip. In this case I just plugged the TX line (white in my cable) to the UART RX line on the chip (D1) and GND to GND.
To test it, I just followed Adafruit’s instructions to open up a screen session on my (linux) laptop. I was immediately greeted with and ASCII stream of data in a meaningful format. The FT232H starts up in its UART serial mode by default which is exactly what I needed for this device. Yay: this is an easy project.
Since I didn’t need any advanced features of this chip for this project, I didn’t need to use the Adafruit library or anything. I just wrote a bit of Python 3 code to parse the data:
|
1 2 3 4 5 6 7 8 9 10 11 12 13 14 15 16 17 18 19 20 21 22 23 24 25 26 27 28 29 30 31 32 33 34 35 36 37 38 39 40 41 42 43 44 45 |
""" Digital Level Reader. Reads DXL360 digital level measurements coming in over the serial port. Data comes in via UART, converted to USB with a FT232H or equiv. Format is X+0000Y+0000 Original Purpose: Calibrate/verify star-tracking barn-door camera mount. By: Nick Touran """ import serial import re import time DEV = '/dev/ttyUSB0' BAUD = 9600 MSG_LENGTH = 12 def read(): with serial.Serial(DEV, BAUD, timeout=1) as port: # sync up when you find an 'X' character char = b'' while char != b'X': char = port.read() port.read(MSG_LENGTH - 1) # toss one datum since X was consumed start = time.time() seconds = 0.0 # now read continuously and process into floats while True: datum = port.read(MSG_LENGTH).decode() match = re.search('X([+-]\d\d\d\d)Y([+-]\d\d\d\d)', datum) if not match: raise ValueError('Level did not provide valid data. Check connection.') x, y = match.groups() x = int(x) * 0.01 y = int(y) * 0.01 seconds = time.time() - start print('{:<10.1f} {: 6.2f} {: 6.2f}'.format(seconds, x, y)) yield (seconds, x, y) if __name__ == '__main__': read() |
This code creates a generator that you iterate over very simply for whatever application you need. For my calibration stuff, the plotting code looks like this:
|
1 2 3 4 5 6 7 8 9 10 11 12 13 14 15 16 17 18 19 20 21 22 |
import matplotlib.pyplot as plt import level def measure(duration_in_seconds=20): t, x, y = [], [], [] for seconds, xi, yi in level.read(): t.append(seconds) x.append(xi) y.append(yi) if seconds > duration_in_seconds: break plt.plot(t, x, '.') plt.xlabel('Time (s)') plt.ylabel('Angle (degrees)') plt.title('Level data') plt.grid(alpha=0.3) plt.show() |
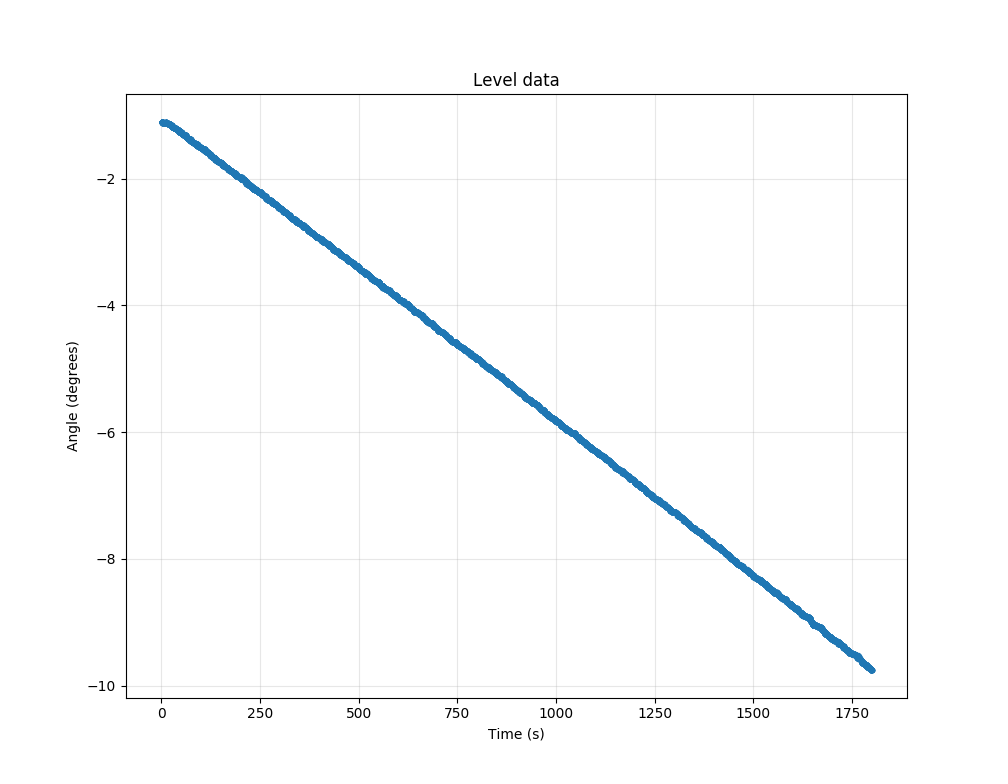
That just reads some data and then plots it, like this: Sweeeeeet.
Coupling a computer to this level really makes it an even more awesome and useful instrument.
Update: I open-sourced this software as part of the startracker project on github.


hello,
I am Mechanical engineering student.
As part of a final project for a degree , I need to work with the DXL360S component.
I would be happy if you would contact me by email and answer a few questions.
Regards,
Good day, code is not my strength. I use DXL360s to measure car alignment cambers. Is there a way a dummy like me can get the screen output to display and subsequently record on something like excel, word.
Thanks!
Hi Phil. The code here is almost all you’d need to do that. You’d run the function and print it out to the screen rather than to a plot like in the 2nd code. But you will need someone to help who can run a python script is all. It’s relatively easy, but does take a certain amount of time commitment to get up and running.
https://docs.python.org/3/tutorial/index.html
I think they’re starting to teach this more in high schools and stuff so maybe see if you can find a volunteer there?
Can any one tell what app i nedd to connect the DXL360S with the blue tooth adaptor to my android Mobile please
Thankyou