I like the concept of measuring flows and so have sensors on my water main and my electric mains. Naturally, I wanted to add a reading of how much bandwidth I’m using and get it displayed in my living room. I already have the following in place:
- My LED matrix infopanel
- A router running OpenWRT
- A local MQTT server (with bridge to a remote one, but that’s irrelevant for this post)
As it turns out, this is enough to get live internet usage numbers showing with just a few simple scripts.
First we need to just get the speed from the router. Bmon is a great choice for this. Before long I had figured out the command to show my WAN transmit and receive rates on stdout.
root@thewrt:~# bmon -p eth1  -r 5.0 -o format:fmt='$(element:name)\t$(attr:rxrate:bytes)\t$(attr:txrate:bytes)\n'
 eth1    0.00    0.00
 eth1    265898.28   19053.59
 eth1    67773.42    9319.65
 eth1    18138.26    3054.41
This refreshes every 5 seconds. Then I just wanted to send that to the MQTT server so I wrote this bash script:
#!/bin/bash

down=$(echo "scale=2; $2/1000" | bc)
up=$(echo "scale=2; $3/1000" | bc)
/usr/bin/mosquitto_pub -h host.int -u muser -P password -t home/matrix/$1down -m "$down"
/usr/bin/mosquitto_pub -h host.int -u muser -P password -t home/matrix/$1up -m "$up"
The script takes 3 arguments: interface, download speed, tx speed. It converts from bytes/s to kB/s using the bc (note that bash can only do integer division) and then sends the tx and rx speeds to the mqtt server at host.int.
To get this all to work on my router I did have to opkg install a few tools, like bmon, bc, bash, an upgraded xargs, and mosquitto_clients.
Then to tie it all together I wrote another script based on the upper command. It uses xargs on every newline to pass the three columns above as three arguments into this MQTT submission script. Pretty easy:
#!/bin/ash

/usr/sbin/bmon -p eth1,wlan1  -r 5.0 -o format:fmt='$(element:name)\t$(attr:rxrate:bytes)\t$(attr:txrate:bytes)\n' | xargs -L1 /usr/bin/submit-bitrate-to-mqtt.sh
So that will just run forever, updating the local MQTT service with the latest speeds every 5 seconds. Then I just made it a service by making a file in /etc/init.d.
#!/bin/sh /etc/rc.common
 START=50
 USE_PROCD=1
 PROG=/usr/bin/hass-bitrates.sh
 PIDFILE=/var/run/hass-bitrates.pid
 start_service() {
     procd_open_instance hass-bitrates
     procd_set_param command $PROG
     procd_set_param pidfile $PIDFILE
     procd_close_instance
 }
 all_child_pids() {
     pid=$1
     echo $pid
 for child_pid in $(pgrep -P $pid); do     echo "$(all_child_pids $child_pid)"; done
 }
 stop_service() {
     for pid in $(all_child_pids $(cat $PIDFILE)); do
         kill $pid
     done
 }
 reload_service()
 {
         stop
         start
 }
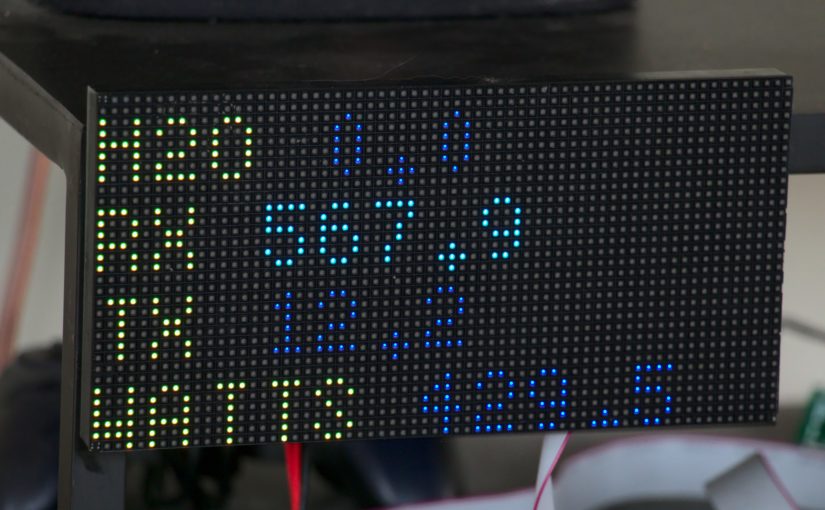
And then in the infopanel I just set up a few new simple sprites and scene for all the flows.
   upload:
       type: Temperature
       label: TX
       low_val: 0.0
       high_val: 2000
       val_fmt: " {:.1f}"
       data_label: eth1up
   download:
       type: Temperature
       label: RX
       low_val: 0.0
       high_val: 2000
       val_fmt: " {:.1f}"
       data_label: eth1down
And that’s it! Very nice.