Sensors are fun! I wanted to keep an eye on the temperature of one of my home physics projects and realized I needed a thermocouple and a convenient way to read it. This post is about how I got one and wrote a Python program to send the data from a Raspberry PI over the network to my laptop, which plots the results in real time.

I bought a K-type thermocouple for several dollars that ranges from -100°C to 500°C. The Seebeck effect that makes it work only gives microvolts per degree so I needed a good amplifier for it. And since I wanted to read it on a Raspberry PI (which only has digital inputs), I’d need an analog-to-digital converter (ADC). Conveniently, the MAX31855 does amplification and ADC and is like $15, so I got one. Sweet. There’s even a Python library for it that makes it easy to access. Double-sweet.
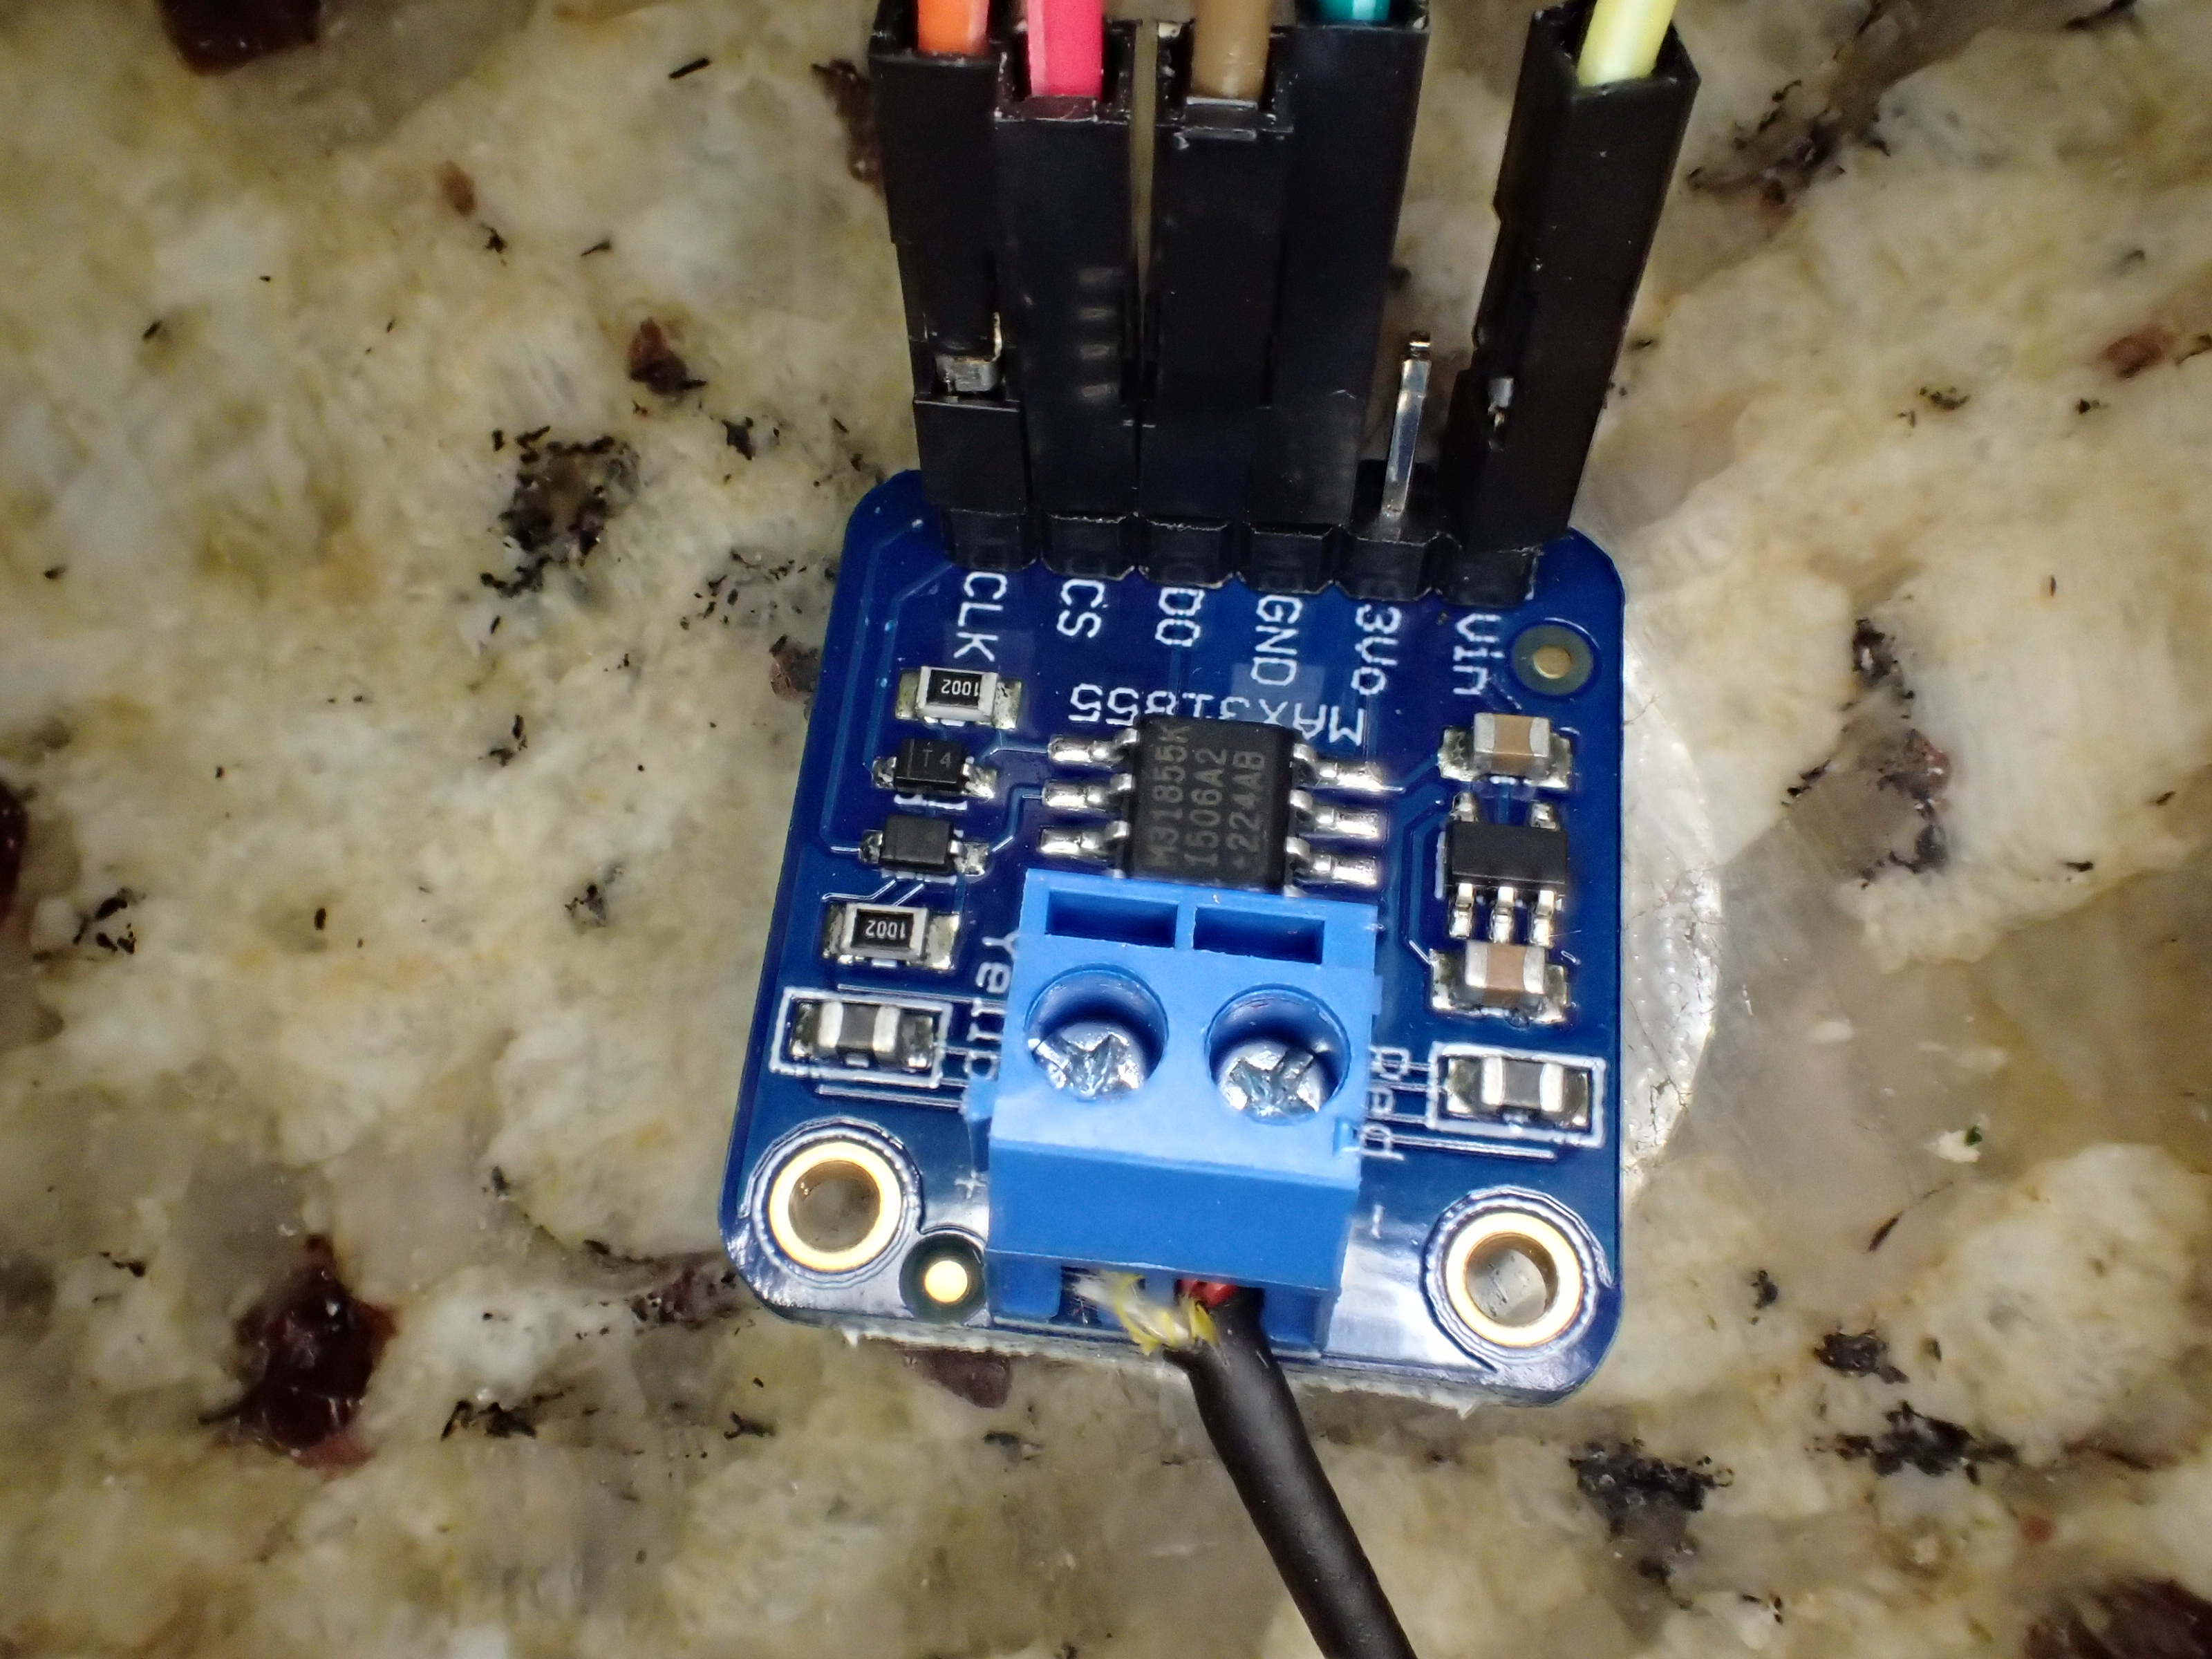
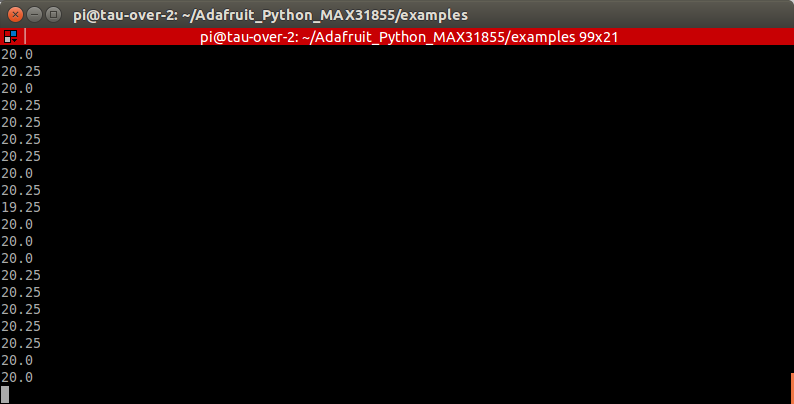
I decided to hook it up to the hardware SPI interface on the PI. This was supposed to be fastest so I figured, why not. On a RPi B+, that’s 3.3V -> Vin, GND -> GND, SCLK(GPIO11)->CLK, CE0 (GPIO 8)->CS, and MISO(GPIO 9)->DO. Easy enough. Then I just uncommented the Hardware SPI section in the Adafruit Python library example and got some readings. Excellent. It actually has a build-in temperature sensor as well so you can get its temperature and the temperature at the end of your thermocouple wire.
At first I tried getting the Raspberry PI to plot it live. But frankly, it was just too slow to handle the live-plotting plus the encryption and forwarding of the X11 graphics over ssh (I even dumbed down the encryption since I was on a local network). Maybe a RPI2 could handle it, but the B+ was too slow. So I got the idea to send the data over the network to my laptop which could spend all the CPU it wanted on animating plots and updating and stuff. I had to learn some stuff about the Python socket module, but it was really pretty straightforward. I made a client script that runs on the PI, reading the sensor and transmitting the data. My server script runs on the laptop and receives the data, plotting it live.
Plotting live data
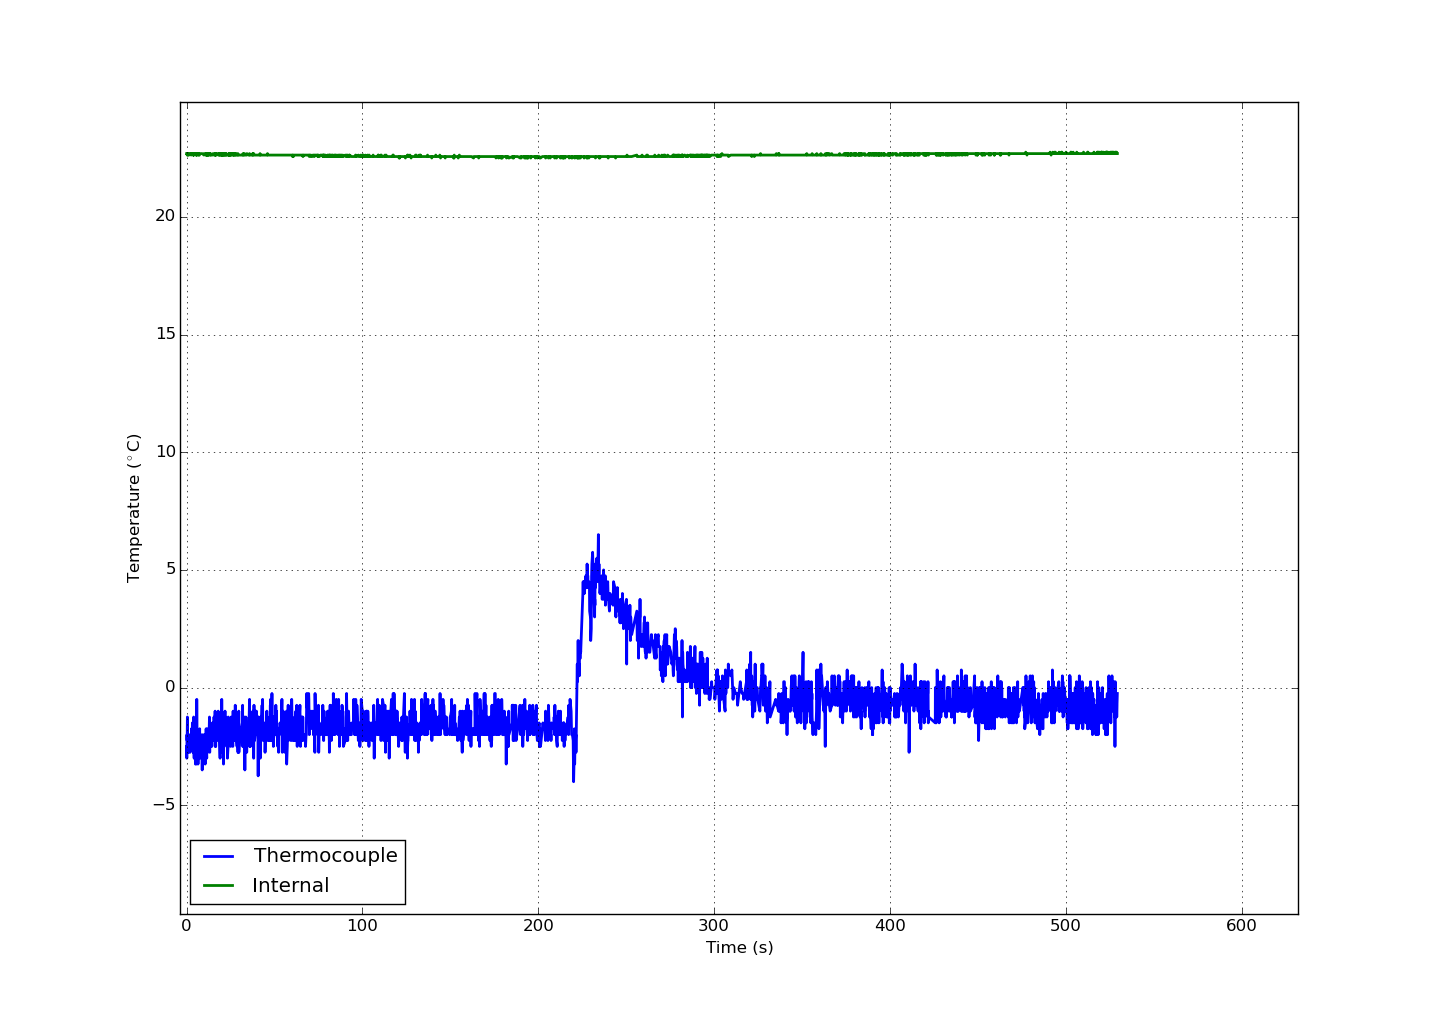
Plotting the live data isn’t too bad with matplotlib, though it was a bit tricky due to the ongoing network communication. First, just get a plot animation going using one of the examples of the FuncAnimation. This decay one is particularly useful. Once you have that running and fully understand it, then modify the data_gen method to give you data off the network as it becomes available.
You’re going to need Threads. The real trick is to use a Queue which I learned about in this great presentation on Python concurrency. My implementation is still not excellent (it hangs a lot), but it gets the job done. Check out my full code and improve it if you want. It’s hosted on github.
Hello
Just been reading your post on the thermocouple and max31855 amplifier, I am completely new to raspberry pi with no coding experience etc., I’m trying to setup 3x thermocouple sensors to display on a graph and record the results. I have downloaded the zip file from GitHub but tbh I’m completely lost not even sure when I’m supposed to do with this I’ve tried running the files in thonny but I just receive errors invalid syntax etc. ?? I would really appreciate if you had some time to explain to me step by step how to get these sensors up and running, I have got some basic experience with node-red would this be a possibility?
Cheers any help much appreciated…..Niki